


내용 좋아서 퍼옴 밑에 번역글 있음 ㅎㅎ
11% profits were added to my investment portfolio after my last idea. Currently, I have roughly 39% long positions entered around $7,000, 12% at $7,700 and 49% in fiat.

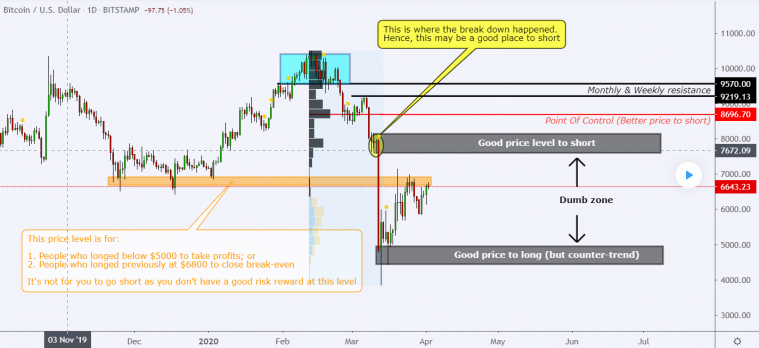
In my recent idea, I told you $6,800 - $7,000 was my target for taking profits (orange box) due to the weekly resistance level . The resistance level was due to:
- Traders who longed below $5,000 are likely to take profits
- Traders who longed previously at $6,800 are closing their positions at break-even after the significant dump.
$6,800 is a resistance level to take profits on long positions, but it does not mean it was a good price level to short. I see many traders get confused between the two (close profits on long positions =\= time to open short positions).
Whenever you open a position you need to consider the risk reward to see whether it is worth the risk to open a trade. Let’s examine an example below. While both trades have identical Stop Loss and Target, the risk rewards are vastly different depending on the entries. One can give you only x1 gain while the other can give you x5 gain. So, would you take trade #1 or #2?
See, when you think logically everything starts to make sense.
Another problem with many traders is that they don’t have the patience to wait for the market to reach important support/resistance levels. They are desperate for actions and trade setups as they either have no patience or they believe trading frequently is the way to make money. Consequently, they always trade the dumb zone – the zone that has no significant support/resistance , low volatility and with a poor risk reward ratio.
-------------------------------------------------------------------------------------------------------
Market trend and cycle
On the 4th of July 2019, I explained it to you why I don’t think a new bull run has started and why I believe the market is trying to define its market range, probably between mid $5k and $16k. The market is still following the range for now. (click below chart & play)

I have also warned you that Bitcoin is in a transition phase (and, in a ranging market) which is extremely challenging to trade. Patience is critical during this market phase.
From the weekly timeframe, we can assume the market may consolidate for some time going forward (until either side is broken) because:
- the high is getting lower and the low is getting higher
- although weekly 50EMA & 55EMA have become resistance, weekly 200MA is currently still holding and both weekly 200MA & 50MA are pointing upwards
- you can say the market is in either an uptrend or a downtrend depending on which period you look at to determine the market trend. For instance, if you look at it from Dec 2018 the market is in an uptrend. But if you look at it since June 2019 it is in a downtrend. At times like this (ie no clear direction), the buyers are trying to buy each support while the sellers are trying to sell each resistance which cause the market to consolidate.
On the daily timeframe, undoubtedly the market is in a downtrend. Thus, from a swing trade perspective you should focus on shorting the market. Two price levels that I would be interested in shorting are:
1. Around $7,500 - $7,900 where the breakdown occurred on the 12th March. Looking at how the price reacts to this level is highly recommended.
2. $8,700, where the point of control is of the recent downward swing between $10,500 & $3,800. Stop loss should be set above $9,300.
However, bear in mind, the downtrend is invalidated only if price breaks above the recent swing high at $10,500. This means if price decides to break above $10,500 and starts a new bull-run, there is a chance that you might have just missed out on the biggest opportunity in your life.
You might be asking – “what should I do if I want to short the market but don’t want to miss the investment opportunity?” Simple, allocate part of your capitals for trading purposes and the other for investment purposes.
-------------------------------------------------------------------------------------------------------
**This post is for informational purpose only. I will not be held liable or responsible to you in any way for any loss or damage suffered by you through use or access to this post**
번역(첫문단은 불필요한 내용이라 넘김)
최근 아이디어에서 난 6800~7000달러가 수익을 내기위한 목표 주간저항선이라고했다.
저항선이라고 판단한 근거는
1. 5000달러 아래에서 롱포지션을 잡은 트레이더는 수익구간일 가능성이 높으며,
2. 이전 6800달러위치에서 롱포지션을 잡은 트레이더는 큰 낙폭이 발생했더라도 자신의 포지션을 청산했을 것이기 때문이다.
6800달러 저항은 롱포지션의 수익을 실현하기위한 좋은 저항구간이지만, 숏포지션을 타기 좋다는 뜻은 아니다.
많은 트레이더들이 롱포지션의 수익을 실현하는 타이밍이 숏포지션의 진입타이밍이라고 착각하는 것이 보인다.
투자자들은 어느 포지션에 진입하던 간에, 그 진입이 위험을 감수할 가치가 있는지 RR비율을 고려할 필요가 있다.
아래의 예시를 보자.
두 매매 전부 동일한 손절매라인과 목표가가 있지만, 진입타이밍에 따라 리스크 대비 수익률에 차이가 있다.
한 쪽이 5배 이익을 가져다 줄 동안 다른 한쪽은 겨우 1배 이익을 가져다주는데, 그럼 첫번째와 두번째 진입타이밍 중 어느 것을 선택하겠는가?
논리적으로 생각하기 시작할 때 비로소 모두 말이되기 시작한다.
대다수 트레이더들의 또다른 문제점은 지지저항선을 기다릴 인내심이 부족하다는 것이다.
그들은 인내심이 없거나, 거래를 자주하는 것이 돈을 벌어다준다는 생각을 가지고있으면서 투자기법이나 무언가 행동을 취하는 것에 매달린다.
이에 따라 그들은, 중요 지지저항이 없고 변동성이 낮으며 RR비율(위험에따른 보상비율)이 낮은 "댕청구간"에서 거래하게 된다.
---------------------------
시장의 트렌드와 순환
19년7월4일, 나는 왜 새로운 상승장이 시작되지않았다 생각하는지, 그리고 왜 시장의 범위가 5k중반~16k로 정의된다고 믿는지에 대해 설명해 준 바 있다.
시장은 아직도 그 범위안에 머무르는 중이다.(아래차트를 봐라)
또한 나는 BTC가 매매하기 어려운 전환국면에 있다고 경고도 하였었다. 이 국면은 인내심이 매우 중요하다.
주간타임프레임을 보면,
우리는 한쪽 세력이 무너지지않는 한 시장은 한동안 횡보세를 유지할 것이라고 볼 수 있다.
그 이유는:
1. 고점이 낮아지고 저점이 높아지고 있으며,
2. 주봉기준 50EMA와 55EMA가 저항이 되었지만, 200MA가 버텨주고 있으며 200&50MA 둘 다 상향하고 있고,
3. 어떤 타임프레임으로 보느냐에 따라 상승의견과 하락의견이 바뀌기 때문이다.
예를들어 18년 12월부터 시장을 보면 상승세가 맞다.
그러나 19년 6월부터 보면 침체되는 중이다.
이런 상황에서 매수세력은 지지선에서 꾸준히 매수하고, 매도세력은 저항선에서 꾸준히 매도하게되는데, 이게 시장을 횡보하게만드는 이유이다.
일간 타임프레임을 보면,
의심의 여지없이 시장은 하락세다. 그렇기 때문에 스윙트레이딩관점에서 숏포지션을 잡는것에 집중해야한다.
숏포지션을 잡기에 괜찮을만한 가격대는,
1. 3월12일에 폭락이 발생했던 7500~7900달러 구간
이 가격대에 이르렀을때 시장의흐름이 어떤 방향성을 보이는지 살펴보는 것이 중요하다.
2. 10500&3800달러 사이 하락시작점인 8700달러 구간
손절매는 최소 9300달러 이상으로 잡아야한다.
그러나 전고점인 10500달러를 넘을 경우 하락세가 끝난다는 것을 알아둬야한다. 10500달러를 넘고 새로운 상승장이 나온다면 이것은 생에 있어서 큰 기회를 놓친 것이 될 수도 있다.
아마 이 글을 읽는 사람이라면 "숏포지션을 잡고싶은데 투자기회를 놓치고싶지는 않다면 어떻게해야하나요?" 라고 질문할 수 있을 것이다.
답은 간단하다.
투자금의 일부는 트레이딩목적으로, 나머지는 장기투자목적으로 운용하면 되는 것이다.